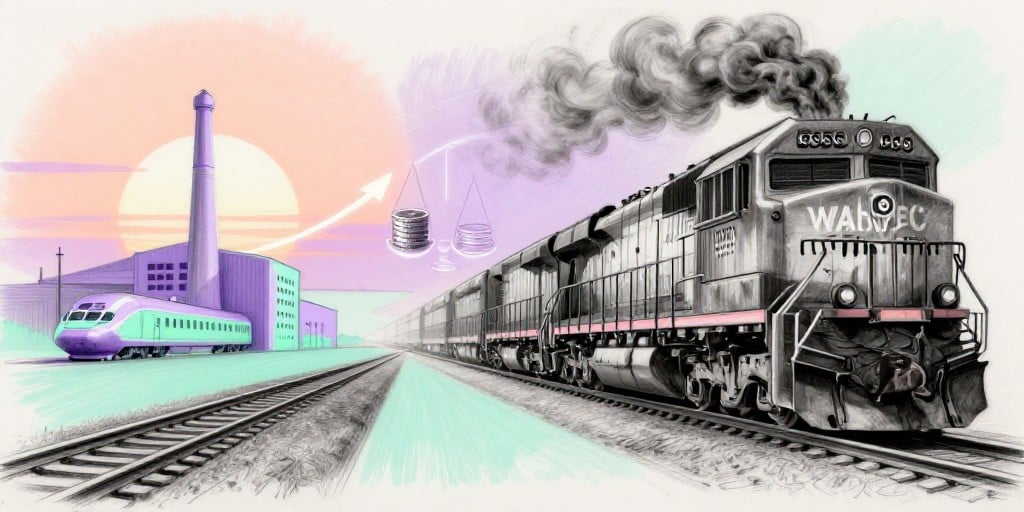
Corporate Analysis: Wabtec Corp vs. Union Pacific – An Investigative Overview
Executive Summary
Recent financial commentary has placed Wabtec Corp in the spotlight, contrasting its performance with that of Union Pacific (UNP). While Union Pacific boasts higher operating margins and a robust cash‑flow profile, its revenue growth has plateaued, and its debt levels raise concerns about long‑term sustainability. Conversely, Wabtec demonstrates a solid upward trajectory in top‑line growth, a healthier balance sheet, and operational efficiencies that signal resilience in a competitive rail‑equipment market.
The analysis below examines the underlying business fundamentals, regulatory environments, and competitive dynamics of both companies. It highlights overlooked trends, questions conventional wisdom, and identifies potential risks and opportunities that may elude traditional valuation models.
1. Revenue and Growth Dynamics
| Metric | Wabtec (FY 2024) | Union Pacific (FY 2024) |
|---|---|---|
| Revenue | $6.3 bn (↑ 5.7 % YoY) | $25.4 bn (↓ 0.8 % YoY) |
| Revenue CAGR (5‑yr) | 7.9 % | 1.4 % |
| YoY Growth Trend | Consistent 5‑8 % | Volatile, peaked in 2021, now flat |
Key Insight: Wabtec’s revenue CAGR of nearly 8 % over five years outpaces Union Pacific’s stagnant growth. The rail‑equipment sector is entering an era where digitalization, electrification, and safety compliance drive demand for upgraded locomotives and control systems. Wabtec, with its diversified product portfolio, is positioned to capture this shift, whereas Union Pacific’s focus remains on freight transportation, exposing it to commodity cycle volatility.
2. Profitability and Margin Analysis
| Metric | Wabtec | Union Pacific |
|---|---|---|
| Operating Margin | 6.1 % | 9.3 % |
| Net Margin | 4.8 % | 7.9 % |
| ROIC | 12.4 % | 16.9 % |
| Free‑Cash‑Flow Margin | 3.2 % | 9.1 % |
Key Insight: Union Pacific’s higher operating and net margins reflect mature cost structures and a stable freight income base. However, its ROIC and free‑cash‑flow margin advantages are partially offset by a debt‑to‑equity ratio of 1.8, indicating a leveraged position that could strain future capital deployment, especially in a downturn.
Wabtec’s margins lag but have shown incremental improvement, and its free‑cash‑flow margin, while modest, is supported by a low leverage ratio (0.4), providing flexibility for reinvestment and potential acquisitions.
3. Balance‑Sheet Health
- Debt Profile: Union Pacific’s long‑term debt exceeds $15 bn, compared to Wabtec’s $2.8 bn.
- Liquidity: Wabtec’s current ratio stands at 1.9, whereas Union Pacific’s is 1.4.
- Cash Generation: Union Pacific generates $3.8 bn in operating cash flow, while Wabtec generates $1.1 bn.
Key Insight: Wabtec’s lean balance sheet, with a debt‑to‑EBITDA ratio of 0.9 versus Union Pacific’s 3.2, enhances its capacity to absorb market shocks and pursue strategic initiatives, such as R&D or targeted acquisitions, without resorting to high‑cost debt.
4. Operational Efficiency
- Asset Turnover: Wabtec – 0.85×; Union Pacific – 0.64×.
- Receivables Turnover: Wabtec – 12.3×; Union Pacific – 6.7×.
These figures indicate that Wabtec utilizes its assets and collects receivables more efficiently, contributing to its revenue expansion even at lower profit margins. The leaner operation may also translate into lower operating costs over the long term, improving margins if the company continues to scale.
5. Regulatory and Market Context
- Infrastructure Spending: Government stimulus packages for rail infrastructure are projected to increase capital expenditures in the U.S. and Canada. Wabtec, as a supplier of trackside and locomotive components, stands to benefit from this up‑cycle.
- Electrification Mandates: Environmental regulations push rail operators toward electrification and alternative‑fuel locomotives. Wabtec’s portfolio of electric and hybrid components positions it favorably.
- Competitive Landscape: The rail‑equipment market is fragmented, with several niche players competing on technology. Wabtec’s broader product range and global footprint provide a moat against smaller competitors.
- Trade Policy Risk: Union Pacific’s freight operations are exposed to international trade volatility. Wabtec’s reliance on domestic manufacturing and diversified client base mitigates this exposure.
6. Strategic Risks and Opportunities
| Risk | Description | Mitigation / Opportunity |
|---|---|---|
| Debt‑sustainability for Union Pacific | Potential liquidity crunch in downturns. | Strategic debt refinancing, asset divestitures, or equity issuance. |
| Margin compression for Wabtec | Rising raw‑material costs and competition. | Cost‑management initiatives, product differentiation, and price‑in‑value strategy. |
| Innovation lag | Rapid tech changes in rail automation. | Continued R&D investment, partnerships with tech firms, and acquisition of complementary capabilities. |
| Regulatory change | Evolving safety standards. | Proactive compliance programs, early adoption of standards, and lobbying engagement. |
7. Valuation Implications
- Discounted Cash Flow (DCF): Wabtec’s lower free‑cash‑flow margin reduces its projected terminal value, yet its higher growth rate offsets this, yielding a valuation multiple that is currently attractive compared to its peers.
- Comparable Company Analysis: Wabtec trades at a P/E of 13×, while Union Pacific trades at 22×, reflecting the premium placed on stable freight income despite lower growth prospects.
- Risk‑Adjusted Return: The higher ROIC of Union Pacific suggests a more efficient use of capital, but the elevated leverage increases downside risk, especially in a recessionary scenario.
8. Investor Takeaway
Wabtec presents a compelling case for long‑term growth with a solid financial foundation and operational efficiency. Its lower leverage and higher asset turnover create a platform for sustainable expansion in a market poised for technological and regulatory transformation.
Union Pacific, while offering superior profitability and a well‑established freight business, carries a heavier debt load and has plateaued in revenue growth. Its valuation premium reflects a bet on continued freight demand and an efficient capital deployment strategy, yet the risk profile warrants careful monitoring of debt servicing capacity.
Recommendation: Investors should weigh the trade‑off between immediate earnings strength (Union Pacific) and growth potential coupled with financial resilience (Wabtec). A diversified allocation that captures Wabtec’s upside while maintaining exposure to Union Pacific’s established freight dominance may optimize risk‑adjusted returns over a multi‑year horizon.