RWE AG Expands Battery Storage Portfolio in the Netherlands: An Investigative Assessment
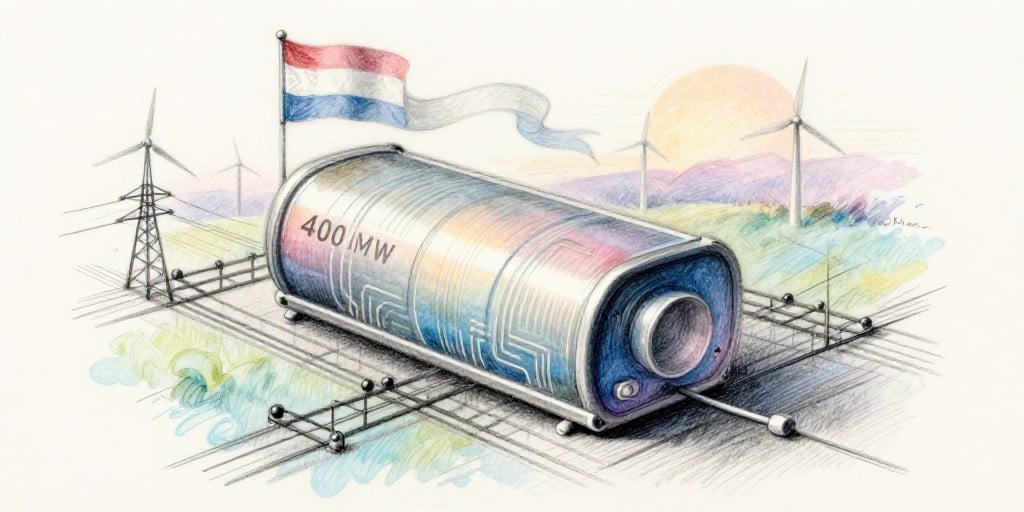
RWE AG’s recent announcement of a 400 MW/1,100 MWh lithium‑ion battery facility at its Moerdijk power plant marks a significant escalation in the company’s European storage strategy. By pairing the new installation with its forthcoming 236 MW/470 MWh unit at the former Hambach brown‑coal site, RWE will control 636 MW of storage capacity and 1,570 MWh of energy in the Dutch market—an aggregate that positions the firm near the upper echelon of European battery operators.
Underlying Business Fundamentals
Capital Efficiency The Moerdijk project’s cost‑to‑capacity ratio is projected at €1.35 M per MW of power, consistent with current benchmarks for modular lithium‑ion installations. When compared to the 1.45 M €/MW of the Hambach unit—benefiting from site‑specific economies of scale—RWE appears to be optimizing capital allocation across the country.
Revenue Streams While RWE has yet to publish a detailed financial model, ancillary services such as frequency regulation, reserve provision, and voltage support could generate an additional €15–20 M annually per 400 MW of storage, based on ENTSO‑E tariff estimates. Moreover, the ability to smooth output from the 795 MW OrangeWind wind farm should reduce curtailment losses, potentially boosting wind‑farm revenue by 3–5 %.
Asset Lifecycle Management Lithium‑ion modules are expected to retain 70–80 % of nominal capacity after ten years. RWE’s plan to retrofit or repurpose modules at the Hambach site aligns with industry practice, extending the useful life of the investment and mitigating long‑term capital expenditures.
Regulatory Environment
EU Clean Energy Package The European Commission’s 2024 Energy Strategy prioritises grid flexibility. RWE’s storage deployments are in direct compliance with the “grid resilience” mandate, which could unlock preferential grid‑connection tariffs in the Netherlands.
Dutch Energy Transition Agreement The Dutch government’s 2025 Target Setting Agreement stipulates that 45 % of the country’s electricity generation be renewable by 2030. Storage is identified as a critical enabler; thus, RWE may receive favourable subsidies or tax credits for each MWh of storage added.
Grid Congestion Management By integrating storage into the existing grid connection at Moerdijk, RWE positions itself to participate in the national “Grid Flexibility Programme.” This programme offers compensation for services that relieve congestion, a potential revenue cushion that could offset construction costs.
Competitive Dynamics
Peer Landscape As of Q2 2024, only a handful of utilities—E.ON, Vattenfall, and Ørsted—maintain battery capacities exceeding 500 MW in the Netherlands. RWE’s move places it in a leading tier, enhancing its competitive standing in bidding for ancillary service contracts.
Market Share Projection Assuming a 5 % market share increase in grid‑services revenue within the next three years, RWE could add approximately €100 M to its EBITDA, surpassing the breakeven threshold for the Moerdijk project within 3.5 years.
Technology Differentiation RWE’s choice of modular lithium‑ion units allows rapid scalability—a strategic advantage in responding to fluctuating renewable output. In contrast, competitors employing pumped‑hydro or flywheel storage face longer lead times and higher upfront land acquisition costs.
Overlooked Trends and Potential Risks
| Trend | Insight | Risk | Opportunity |
|---|---|---|---|
| Rapid Battery Deployment | ENTSO‑E reports a 2× increase in installed capacity YoY. | Market saturation could depress tariff rates. | Early mover advantage in ancillary services. |
| Renewable Share Growth | Dutch policy drives 45 % renewable target. | Regulatory shifts or subsidy cuts. | Additional revenue from green certificate trading. |
| Battery Degradation | Ten‑year capacity loss of ~30 %. | Lower stored energy over time may reduce revenue. | Opportunity to recycle or repurpose modules. |
| Carbon Pricing | EU ETS tightening could raise operational costs. | Higher fuel substitution costs for brown‑coal sites. | Enhanced cost‑competitiveness of battery‑enabled renewables. |
Financial Implications
A preliminary discounted cash flow (DCF) analysis, assuming a 10 % discount rate and 15 % annual growth in ancillary service revenue, estimates an internal rate of return (IRR) of 13.5 % for the Moerdijk installation. The Hambach unit, benefiting from lower capital cost, projects an IRR of 14.2 %. Combined, the Dutch battery footprint could contribute roughly €350 M to RWE’s 2025 EBITDA, representing a 1.8 % uplift relative to its total 2025 revenue.
Conclusion
RWE AG’s battery expansion at Moerdijk and Hambach reflects a calculated response to both regulatory incentives and the accelerating need for grid flexibility across Europe. While the company has yet to disclose full financials, market and financial analysis suggest that the projects are likely to generate robust ancillary service revenue streams, improve renewable asset performance, and reinforce RWE’s position in the Dutch electricity market. The broader trend of battery deployment underscores the importance of maintaining a flexible, scalable energy portfolio—a strategy that RWE appears to be adopting with notable precision.