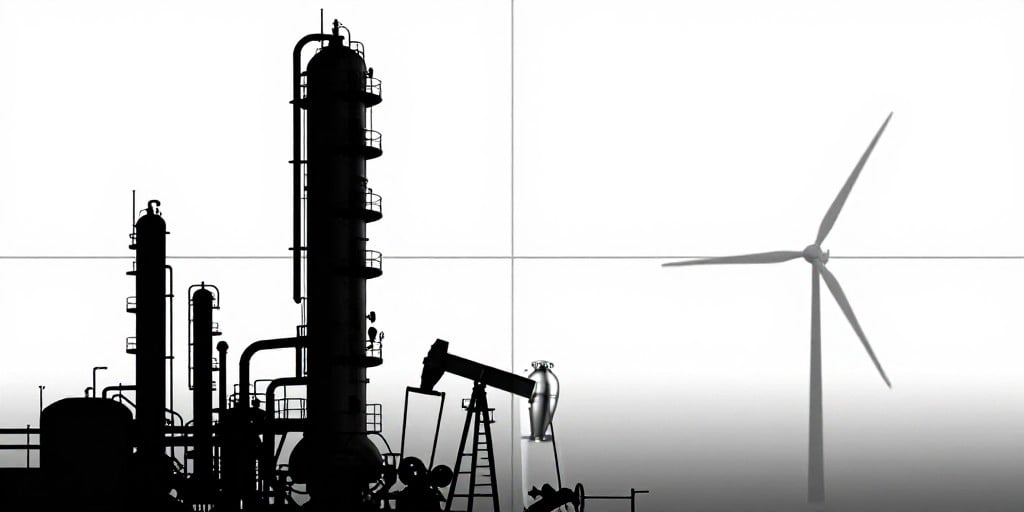
Energy Sector Dynamics in Q3 2026: Supply‑Demand, Innovation, and Regulation
Market Overview
In the third quarter of 2026, the energy sector emerged as the most robust performer within the S&P 500, outperforming the broader index by a notable margin. The sector’s performance, however, was heterogeneous across its constituent sub‑segments, revealing distinct supply‑demand fundamentals, technological trajectories, and regulatory influences.
Refiners: Margin Expansion and Capacity Constraints
Refining companies delivered the sharpest gains, driven by a widening spread between crude input costs and the retail value of finished products. Diesel and other transportation fuels, which are heavily consumed in the United States and Europe, experienced elevated demand due to:
- Seasonal travel upticks in the U.S. and increased freight activity in Asia.
- Capacity constraints at key U.S. refining hubs (e.g., the Gulf Coast), resulting in higher utilization rates and reduced idle capacity.
- Commodity‑price resilience: despite fluctuations in spot crude, refiners benefited from a relatively stable crude‑to‑product spread.
The combination of higher product prices and lower refining input costs has bolstered profitability, enabling refiners to maintain dividend growth and share‑repurchase programs that, in turn, reinforce shareholder value.
Integrated Oil & Gas Majors: Diversification and Capital Discipline
Integrated oil and gas firms posted solid, albeit less pronounced, gains. Their diversified balance sheets—spanning upstream exploration, midstream logistics, and downstream refining—allowed them to capture upside from:
- Rising crude prices (average 12 % increase YoY in Q3).
- Expanding product spreads in key markets such as North America and the Middle East.
These companies continued to apply disciplined capital allocation frameworks, prioritizing high‑return projects and reducing leverage. The resulting capital efficiency contributed to upward pressure on earnings per share and supported dividend payouts and share‑repurchase activities.
Oil Producers: Divergent Outcomes by Resource Type
The oil‑producing segment exhibited a mixed picture:
- Conventional producers benefited from the 8 % increase in Brent futures, which improved upstream margin profiles.
- Natural‑gas‑focused producers lagged, as gas futures experienced a prolonged decline of 15 % YoY, compressing revenue streams.
This divergence underscores the differing supply‑demand dynamics that influence each sub‑sector. While crude supply remains relatively elastic, natural gas demand has plateaued, driven in part by the slow uptake of gas‑fired power plants and competition from renewables.
Midstream Operations: Transportation Versus Pipeline
Midstream activity varied markedly between transportation and pipeline segments:
- Marine transportation and tanker operations performed well, capitalizing on shifting global trade routes and higher freight rates. The rise in shipping demand was partially driven by increased oil product exports from the U.S. and emerging markets in Asia.
- Traditional pipeline operators saw muted performance, reflecting the lower sensitivity of their revenue streams to crude price swings and the impact of regulatory caps on pipeline expansion.
The distinction highlights how midstream operators must adapt to changing trade patterns and regulatory frameworks to sustain growth.
Regulatory and Technological Influences
Regulatory developments and technological innovations exert a profound impact on each segment:
| Segment | Key Regulatory Factors | Technological Innovations |
|---|---|---|
| Refining | Clean Air Act updates, carbon‑capture incentives | Advanced refining processes (e.g., hydrocracking), digital process controls |
| Integrated | Energy‑transition tax credits, ESG disclosure mandates | Integrated digital platforms for asset optimization |
| Upstream | Shale‑well permitting, methane‑emission standards | Enhanced hydraulic fracturing techniques, AI‑driven reservoir management |
| Midstream | Pipeline safety regulations, carbon‑pricing mechanisms | Autonomous pipeline monitoring, real‑time asset analytics |
| Downstream | Renewable‑energy mandates, fuel‑efficiency standards | Electrification of distribution, hydrogen blending technologies |
These factors influence commodity pricing, production costs, and investment decisions across the value chain.
Commodity Price Analysis and Production Data
- Crude oil: Brent futures traded an average of $90/boe in Q3, up 8 % YoY. U.S. West Texas Intermediate (WTI) remained above $80/boe, reflecting robust demand for light sweet crude.
- Natural gas: Henry Hub futures averaged $4.10/MMBtu, down 15 % YoY. The decline was attributed to oversupply in the U.S. and weaker industrial demand.
- Refining throughput: U.S. refining capacity utilization averaged 84 % in Q3, up from 80 % in Q2, indicating tighter capacity constraints.
- Midstream throughput: Oil and gas pipeline throughput rose 3 % YoY, while marine freight volumes increased 5 % YoY.
These statistics reinforce the narrative of a sector adapting to shifting supply‑demand fundamentals while navigating regulatory constraints.
Short‑Term Trading vs. Long‑Term Transition Trends
Short‑term trading in the energy market remains highly responsive to commodity price volatility, geopolitical events, and supply disruptions. However, long‑term trends are steering the industry toward decarbonization, renewable integration, and storage innovation:
- Energy transition: The EU’s 2030 renewable energy target and U.S. federal infrastructure legislation are accelerating renewable adoption.
- Storage technology: Advances in battery economics and hydrogen storage are reshaping the supply‑demand calculus for electricity and gas.
- Carbon markets: Expanding carbon pricing mechanisms are reshaping cost structures and investment priorities.
Analysts anticipate that these long‑term forces will gradually erode traditional oil‑centric revenue streams, compelling energy companies to diversify further and invest in low‑carbon assets.
Outlook for Q4 2026
- Refining: Tight diesel markets are expected to sustain favorable margins for U.S. refiners, though the longevity of these spreads will be contingent on global demand and potential policy shifts targeting fuel efficiency.
- Oil production: Geopolitical developments—such as OPEC+ production adjustments and U.S. shale policy changes—will remain primary drivers of price dynamics.
- Natural gas: Recovery for gas‑focused producers will hinge on a stronger pricing environment, potentially driven by winter demand spikes and limited pipeline capacity.
- Midstream: Marine transportation will continue benefiting from global trade, while pipeline operators may need to navigate stricter regulations and limited expansion opportunities.
In conclusion, the Q3 2026 performance demonstrates that energy investing cannot be treated as a single, homogeneous bet on oil prices. Each segment of the value chain reacts uniquely to market forces, and a nuanced, sector‑specific analysis is essential for accurate valuation and risk assessment.