
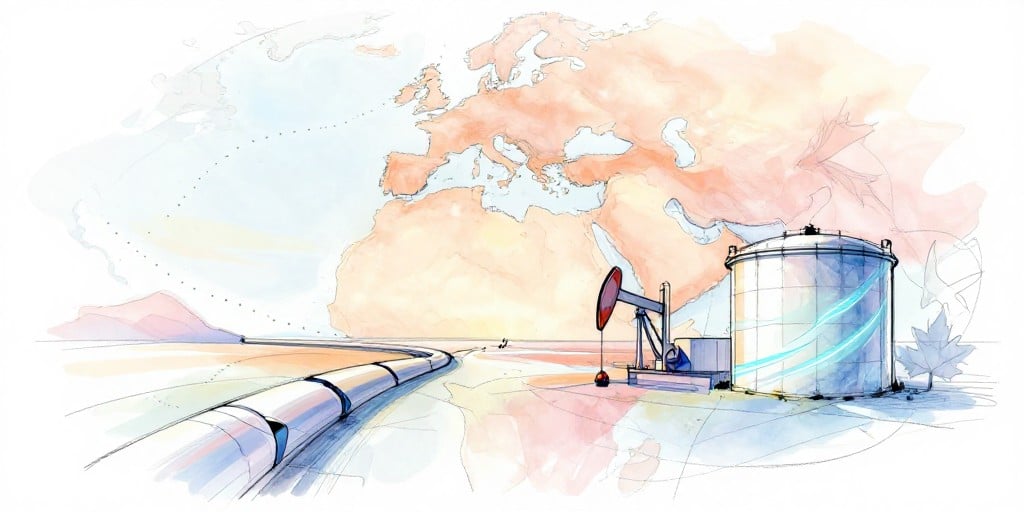
Corporate‑News Analysis of Current Energy Market Dynamics
1. Overview of Physical vs. Paper Market Disparities
Recent market commentary has underscored a widening disconnect between financial speculation and the underlying physical supply landscape for crude oil. While futures markets have largely adopted a narrative of reduced geopolitical tension, physical indicators continue to point to substantive shortfalls in Middle‑East exports. Specifically, data from the Strait of Hormuz—a critical chokepoint for global oil flows—reveal persistent bottlenecks.
Concurrently, alternative transit corridors such as the Yanbu and Fujairah pipelines are experiencing intermittent disruptions, driven by a combination of maintenance cycles, unexpected outages, and operational constraints. Analysts emphasize that any temporary rebound in shipping volumes is unlikely to translate into a sustained recovery; instead, logistical challenges now extend beyond the Strait, encompassing storage capacity limits, terminal loading schedules, and escalating insurance costs tied to war‑risk premiums.
2. Supply‑Demand Fundamentals in the Oil Market
The global oil market remains in a state of high demand relative to supply. Production data from the International Energy Agency (IEA) and the Organization of the Petroleum Exporting Countries (OPEC) indicate that Brent crude output has plateaued at roughly 70 million barrels per day, whereas demand projections for 2026 remain above 80 million barrels per day. This 10 % shortfall is concentrated in the Middle East, where political uncertainty and infrastructure constraints are the primary drivers.
On the supply side, OPEC+ has maintained a production‑cut policy to support prices, yet the cumulative effect of cuts has not fully offset the supply gap created by transit bottlenecks. The result is a persistent upward pressure on spot prices, which, in turn, fuels higher crack spreads in the refining sector.
3. Technological Innovations in Production and Storage
Enhanced Oil Recovery (EOR): Several large‑scale EOR projects are underway in the Middle East and West Africa. By injecting CO₂ or steam into mature reservoirs, operators aim to increase recovery rates by up to 15 %. This technology is expected to alleviate supply constraints over the next 5 years, but its implementation is capital‑intensive and subject to regulatory approval.
Hydrocarbon Storage Infrastructure: To mitigate short‑term supply disruptions, there is a growing investment in underground storage facilities, particularly salt caverns in the Gulf region. New capacity of 150 million barrels is projected by 2028, providing a buffer against transit delays.
Digital Logistics Platforms: Blockchain‑based shipment tracking and AI‑driven routing algorithms are being deployed to optimize pipeline usage and reduce idle time. These platforms enhance transparency for insurers and reduce war‑risk premium volatility.
4. Regulatory Environment and Its Impact
Regulatory developments are reshaping the energy landscape. In the United States, the Biden administration has accelerated the permitting process for offshore wind and hydrogen projects, which are expected to diversify the supply base for liquid fuels via green hydrogen conversion. In the European Union, the Carbon Border Adjustment Mechanism (CBAM) is projected to raise the cost of imported fossil fuels by 12 % over the next decade, potentially shifting demand toward renewable alternatives.
For traditional oil and gas producers, the European Union’s 2030 emissions reduction target of 55 % has prompted stricter operational standards, compelling companies to adopt carbon capture and storage (CCS) technologies. These regulatory shifts are likely to increase capex requirements but also open new revenue streams through the sale of captured CO₂ for enhanced oil recovery and industrial applications.
5. Refining Margins and Corporate Outlook
The tightening of crude supply has translated into higher crack spreads. Current spreads for light sweet crude are hovering around $12 per barrel, up from $8 a year ago, while medium‑heavy grades see spreads exceeding $20. This expansion in margins is most pronounced for Canadian refineries, particularly Suncor, Cenovus, and Imperial Oil.
All three firms have announced robust quarterly results:
| Company | Expected Free Cash Flow | Debt Reduction | Share Buyback Programme |
|---|---|---|---|
| Suncor | $4.2 bn | $1.5 bn | $800 m |
| Cenovus | $1.8 bn | $600 m | $500 m |
| Imperial Oil | $3.0 bn | $1.2 bn | $700 m |
These metrics underscore the companies’ strategic positioning to capitalize on favorable market conditions, even as they navigate the broader supply‑chain constraints.
6. Commodity Valuation and Asset Pricing Correlation
The divergence between physical market signals and futures pricing is also observable in broader asset markets. Oil futures, which have historically acted as a catalyst for gold valuations through the risk‑off/risk‑on dichotomy, have weakened in recent weeks. Should oil prices realign with underlying supply constraints—either through a sustained rebound in transit volumes or through a reassessment of geopolitical risk—the correlation between oil and other commodities may shift, prompting a reassessment of commodity valuations across the board.
7. Conclusion
In sum, the current energy environment is characterized by a pronounced mismatch between market sentiment and physical realities. While financial markets project a rapid normalization of oil flows, physical indicators—particularly in the Middle East—highlight ongoing supply chain bottlenecks. Nevertheless, refining companies positioned to benefit from higher crack spreads are poised for favourable outcomes, supported by strong free‑cash‑flow projections and strategic capital allocation.
The interplay of supply‑demand fundamentals, technological innovation, and evolving regulatory frameworks will continue to shape the trajectory of both traditional and renewable energy sectors. Investors and corporate strategists alike should monitor the convergence of these dynamics to anticipate potential shifts in commodity valuations and corporate performance.