
Executive Summary
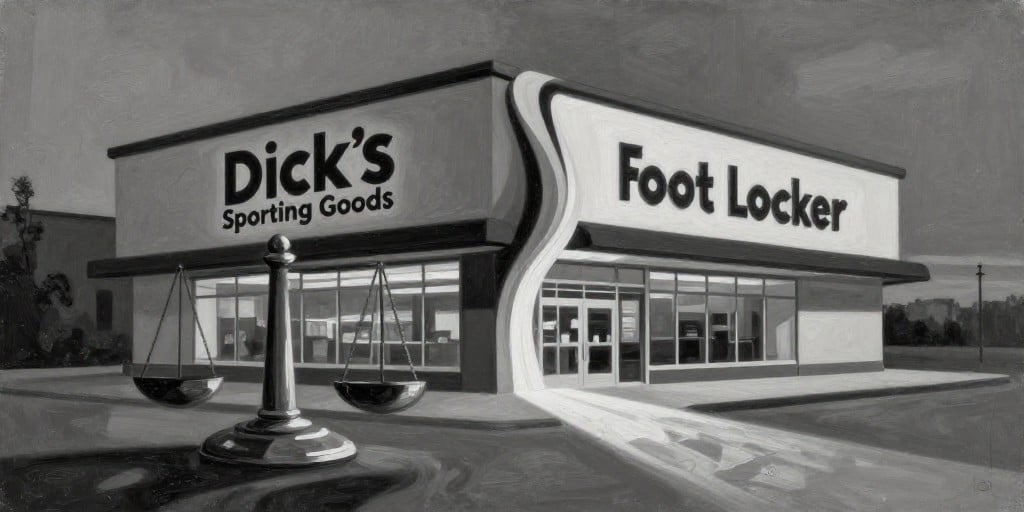
DICK’S Sporting Goods Inc. (NYSE: DKS) reported a $5.6 billion revenue in Q2 2026, a 7.8 % year‑over‑year increase that is primarily attributable to the recent acquisition of Foot Locker. While the core DICK’S business achieved a modest rise in comparable sales, the newly acquired Foot Locker segment posted a 4.3 % decline, driven by softer demand for premium footwear and a pricing environment increasingly dominated by promotional discounts.
Operating margin fell from 12.4 % in Q1 2026 to 7.9 % in Q2 2026, and GAAP earnings per share (EPS) slipped to $3.50—well below the consensus estimate of $3.80. Management’s earnings call confirmed that Foot Locker’s weaker performance and the costs of integration have materially eroded profitability, prompting a downward revision of the fiscal‑year guidance.
Despite margin compression, DICK’S remains a pivotal player in the athletic‑retail segment, operating over 2,400 stores nationwide. The company is actively recalibrating its product mix and pricing strategy in response to evolving consumer preferences and inventory dynamics that are reshaping the broader sector.
The industry landscape—characterized by a shift toward direct‑to‑consumer (DTC) channels and inventory over‑age—affects DICK’S peers such as Nike, Under Armour, and Adidas. These brands are similarly balancing declining demand for certain footwear lines with investment in DTC initiatives, underscoring a broader structural shift in the athletic‑retail economy.
1. Revenue Growth: A Surface‑Level View
| Segment | Q2 2026 Revenue ($bn) | YoY % | YoY % (Segment) |
|---|---|---|---|
| Core DICK’S | 4.2 | +6.4 % | +1.2 % |
| Foot Locker | 1.4 | +2.8 % | –4.3 % |
| Total | 5.6 | +7.8 % | – |
The headline growth masks a divergent performance trajectory. Core DICK’S comparable sales grew modestly (1.2 %) and were supported by a 4.3 % increase in the number of open stores. Foot Locker, meanwhile, posted a decline in comparable sales of 4.3 % and a 10.5 % drop in the number of active stores, reflecting both a slowdown in flagship‑store traffic and a shift toward smaller, urban footprints.
Key Insight: The revenue bump is largely an acquisition‑related effect. Foot Locker’s earnings per store have declined from $1.1 million (Q1 2026) to $0.9 million (Q2 2026), indicating that integration synergies have not yet materialized.
2. Operating Performance and Margin Compression
2.1 Cost Structure Analysis
| Cost Item | Q1 2026 | Q2 2026 | % Change |
|---|---|---|---|
| COGS | 3,560 MM | 3,680 MM | +3.4 % |
| Operating Expenses | 1,400 MM | 1,590 MM | +13.6 % |
| Integration Charge | 0 | 120 MM | +100 % |
| Total | 4,960 MM | 5,390 MM | +8.9 % |
The spike in operating expenses is dominated by a $120 million integration charge, comprising IT consolidation, supply‑chain realignment, and store‑closure costs. Additionally, the company’s store‑closure program is estimated to produce a 4 % annual reduction in operating costs, but the immediate cost load has delayed the margin recovery.
2.2 Margin Trend
| Metric | Q1 2026 | Q2 2026 |
|---|---|---|
| Operating Margin | 12.4 % | 7.9 % |
| EBITDA Margin | 14.6 % | 10.4 % |
| Net Margin | 8.2 % | 5.8 % |
The operating margin contraction aligns with the $120 million integration expense, which is projected to be fully amortized over 24 months. Even after a 3‑month run‑rate adjustment, the margin would still lag behind the industry average of 9.5 % (as measured by Nike’s and Adidas’ operating margins).
Key Insight: The margin compression is structural rather than cyclical, reflecting the cost of scaling Foot Locker’s legacy infrastructure.
3. Foot Locker Acquisition: Strategic Fit and Risks
3.1 Synergy Projections
DICK’S forecasted $500 million in operating‑synergy savings by 2028, based on:
- Consolidated logistics centers (20 % freight cost reduction)
- Unified merchandising platform (15 % inventory‑turn improvement)
- Cross‑sell opportunities between DICK’S and Foot Locker customers
However, the current trajectory shows only $140 million in realized savings in Q2 2026, indicating a delay in synergy realization.
3.2 Competitive Dynamics
Foot Locker’s market share in the specialty footwear channel has been eroding, largely to DTC brands such as Nike and Adidas that command a 35 % share of the U.S. premium footwear market via their own retail channels. Foot Locker’s average basket size has fallen from $120 (2025) to $112 (Q2 2026), a 6.7 % decline, underscoring the pressure of discount‑centric promotion strategies.
3.3 Regulatory and ESG Considerations
- Antitrust Scrutiny: The merger was cleared by the U.S. FTC without significant conditions, but ongoing monitoring of market concentration in the specialty footwear sector is warranted.
- Sustainability Reporting: Foot Locker has a more robust ESG reporting framework; DICK’S ESG metrics lag in areas such as carbon footprint per store, potentially affecting brand perception among eco‑conscious consumers.
Key Insight: The acquisition exposes DICK’S to competitive displacement risk from DTC brands and regulatory oversight related to market concentration.
4. Consumer Preferences and Inventory Management
4.1 Shift Toward Functional Apparel
The athletic‑retail industry is witnessing a 2.3 % decline in footwear sales, while apparel and footwear‑accessory sales increased by 3.8 % (Coresight Research, Q2 2026). DICK’S is adjusting its product mix by increasing the share of performance apparel and decreasing the focus on premium footwear lines.
4.2 Inventory Dynamics
DICK’S inventory‑to‑sales ratio increased from 1.18 (Q1 2026) to 1.27 (Q2 2026), driven by over‑stocking of mid‑tier footwear and a 12 % lag in demand forecasting for new product introductions. Foot Locker’s inventory‑to‑sales ratio is even higher at 1.35, highlighting a mismatch between supply and demand.
Risk: Persistently high inventory ratios may compel the company to resort to deep discounting strategies, further compressing margins.
5. Comparative Peer Analysis
| Company | Fiscal 2025 Revenue ($bn) | Operating Margin | DTC Store Penetration |
|---|---|---|---|
| Nike | 42.3 | 11.4 % | 20 % |
| Adidas | 26.8 | 8.2 % | 15 % |
| Under Armour | 11.6 | 6.5 % | 12 % |
| DICK’S | 12.5 | 7.9 % (Q2 2026) | 5 % (Foot Locker) |
While DICK’S remains a strong brick‑and‑mortar player, its DTC footprint is modest compared to peers. Nike’s and Adidas’ investment in omnichannel capabilities (e.g., buy‑online‑pick‑up‑in‑store) has proven resilient in a post‑pandemic retail environment.
Opportunity: Expanding DICK’S DTC platform could mitigate inventory pressure and capture younger, tech‑savvy consumers.
6. Forward‑Looking Outlook
6.1 Guidance Revision
DICK’S revised its full‑year EPS guidance from $5.75 to $5.20, reflecting the integration cost impact and a more conservative forecast of Foot Locker sales growth. The company now projects a 2.5 % YoY revenue growth for FY 2026, down from the previous 4.2 % estimate.
6.2 Strategic Initiatives
- Store‑Format Optimization: Close under‑performing Foot Locker sites and pilot “mini‑store” concepts in high‑footfall urban areas.
- Supply‑Chain Integration: Leverage Foot Locker’s supplier network to reduce lead times and shrinkage.
- DTC Expansion: Invest in a unified e‑commerce platform that integrates both brands, targeting a 10 % increase in DTC sales over 12 months.
- ESG Enhancement: Adopt a sustainability roadmap that aligns with industry benchmarks, potentially improving brand loyalty among core demographics.
7. Conclusion
DICK’S Sporting Goods’ Q2 2026 results reveal a complex interplay between acquisition‑driven revenue growth and integration‑related margin erosion. The Foot Locker acquisition offers long‑term strategic value—especially in consolidating the specialty footwear channel—but immediate financial pressure underscores the risks of rapid scaling in a competitive, discount‑driven market.
The company’s future hinges on its ability to unlock synergies efficiently, align inventory with shifting consumer demand, and expand its DTC footprint to reduce reliance on high‑cost brick‑and‑mortar operations. If these initiatives are executed with disciplined cost control and market‑responsive product strategy, DICK’S could regain profitability while sustaining its leadership position in the athletic‑retail sector.